EdgarStat® contains an internal regression model to calculate the beta-risk coefficient of an individual enterprise stock price return compared to the return of the S&P 500 stock price (market) index. This stock price return regression model is known as the Capital Asset Pricing Model (CAPM).
Let the individual stock price return be calculated with the investment gain or loss formula:
(1) R(t) = {[P(t) / P(t − 1)] – 1}, such that we postulate the linear relation:
(2) Y(t) = α + β M(t)
where the dependent variable is Y(t) = [R(t) + 1] = [P(t) / P(t − 1)] or P(t) = [1 + R(t)] P(t − 1).
The variable M(t) is the stock market price return, measured using the same eq. (1).
In eq. (2), the intercept (= α) is the adjusted stock price return, equivalent to the local short-term sovereign bill return. Some call the intercept “seeking alpha." The slope coefficient (= β) is the derivative of the individual stock price return with respect to the stock market price (index) return.
In EdgarStat, we use monthly R(t) to calculate α, β, and σ = √Var(Y(t)) for individual companies selected by the user. Calculating (2) using quarterly data is sensible, because dividends are reported per quarter of each year.
Example 1: The CAPM Coefficients of Chevron Corp. (GVKEY 2991, Mergent 7846)
(5) Y(t) = 0.8379 M(t) – 0.111, σ = 6.2558
where σ is the residual standard error.
The intercept is not significant (Newey-West t-Statistics are –0.3893), and the slope coefficient is significant with the Newey-West corrected t-Statistics = 11.2001. Count = 490 observations from 2023-01-1 back to 1982-01-31. The R2 = 25.45%, showing that the CAPM linear model is a bad fit for Chevron.
Example 2: The CAPM Coefficients of ConocoPhillips (GVKEY 8549, Mergent 6630)
(3) Y(t) = 1.017 M(t) – 0.1052, σ = 8.2715
The intercept is not significant (Newey-West t-Statistics are –0.2761), and the slope coefficient is significant with the Newey-West corrected t-Statistics = 9.4952. Count = 490 observations from 2023-01-1 back to 1981-12-31. The R2 = 22.34%, showing that the CAPM linear model is a bad fit for ConocoPhillips.
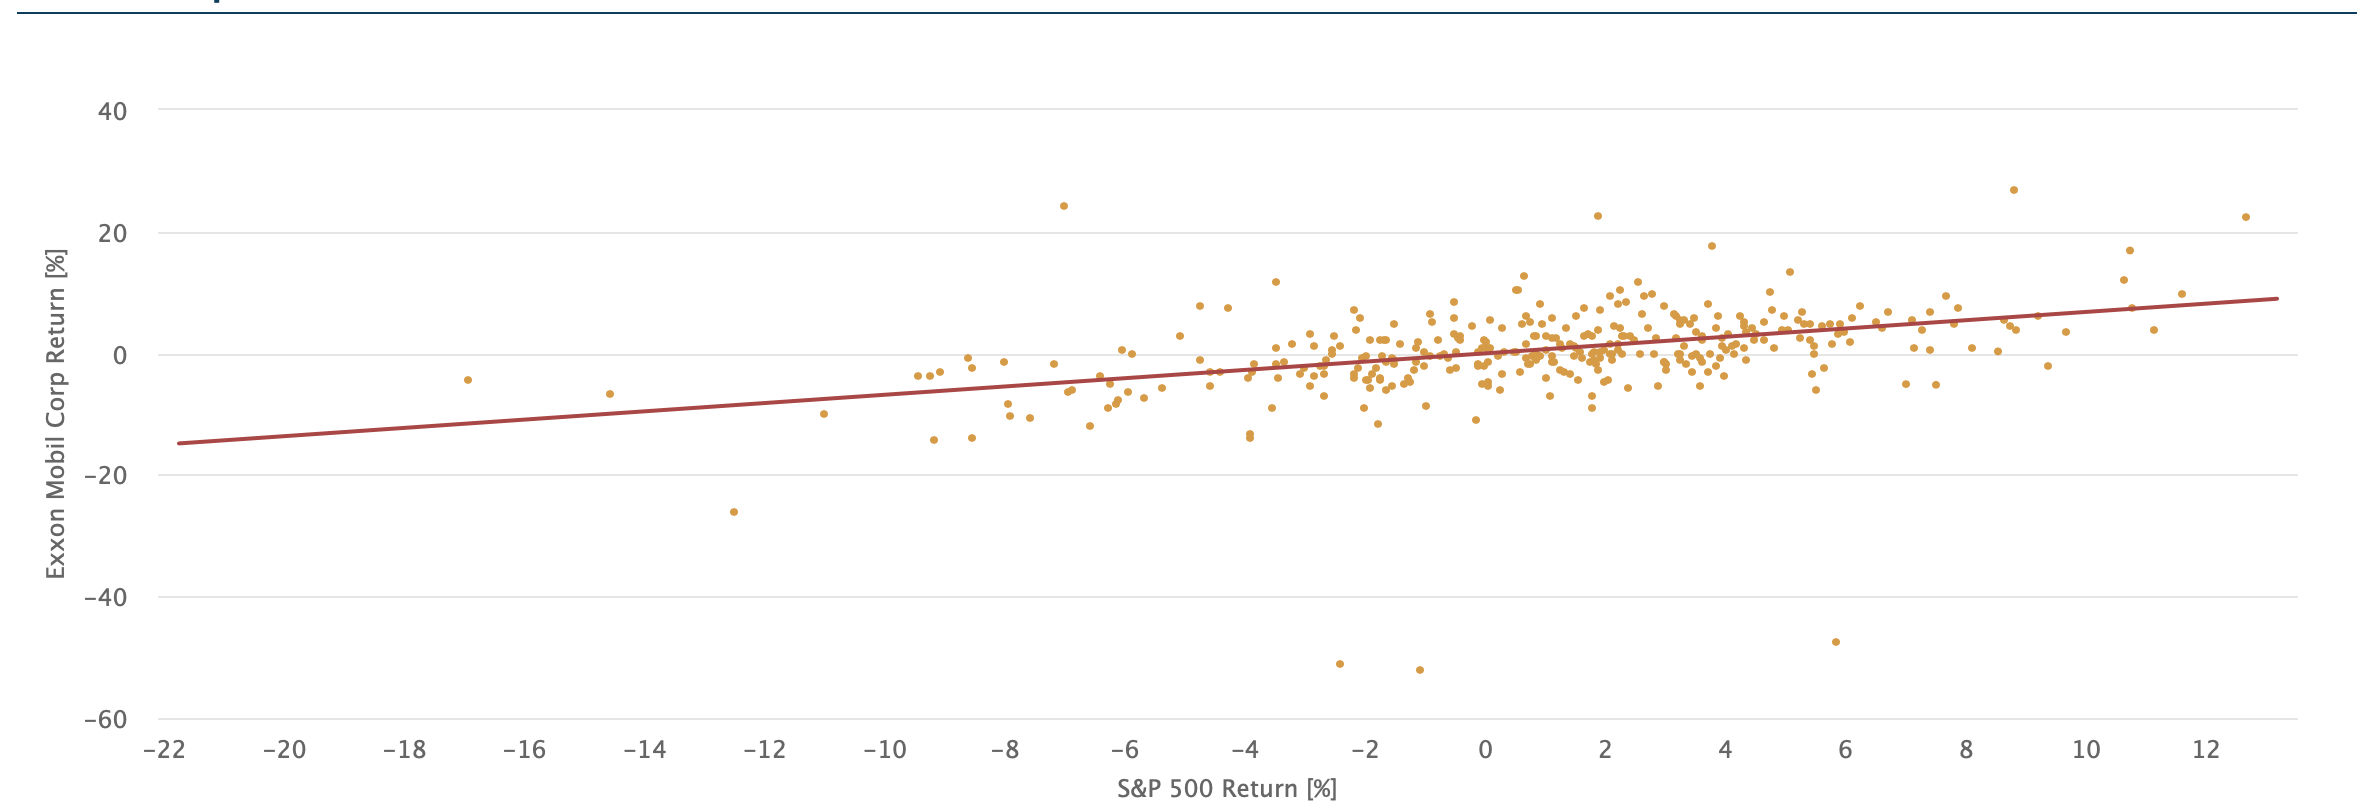
Example 3: The CAPM Coefficients of Exxon Mobil Corp. (GVKEY 4503, Mergent 7846)
(4) Y(t) = 0.681 M(t) – 0.0189, σ = 6.285
The intercept is not significant (Newey-West t-Statistics are –0.0642), and the slope coefficient is significant with the Newey-West corrected t-Statistics = 8.0272. Count = 490 observations from 2023-01-1 back to 1982-01-31. The R2 = 18.26%, showing that the CAPM linear model is a bad fit for Exxon Mobil.
The principal takeaway is that canned beta coefficients are unreliable to use in discounting the expected future stock prices of a selected enterprise to the present. Also, canned beta coefficients are an unreliable measure of risk.
References
Richard Brealey & Stewart Myers, Principles of Corporate Finance (6th edition), McGraw-Hill, 2000, § 8.2 (Relationship between risk and return) and § 9.1 (Measuring betas).
Zvi Bodie & Robert Merton, Finance, Prentice Hall, 2000, § 13.3 (Beta and risk premiums on individual securities).
Chart 1: Chevron Corp. (GVKEY 2991, Mergent 7846)
![]()
Chart 2: ConocoPhillips (GVKEY 8549, Mergent 6630)
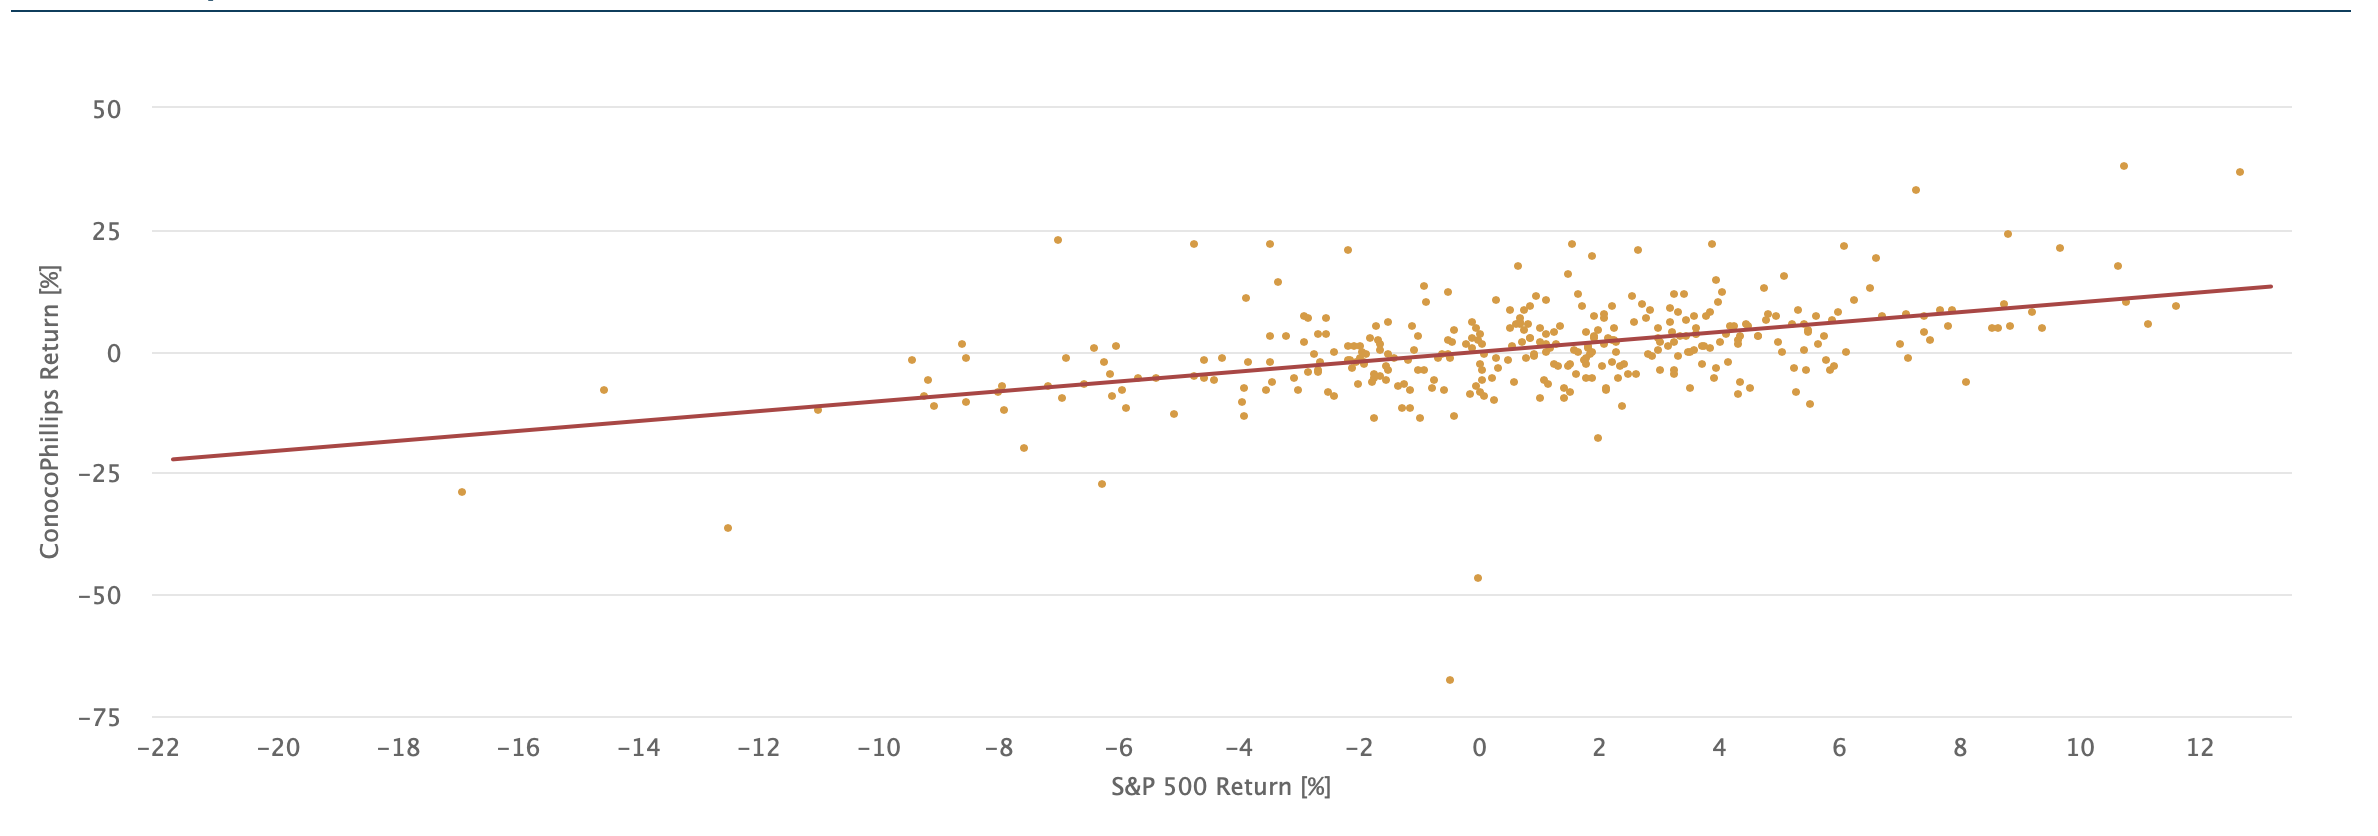
Chart 3: Exxon Mobil Corp. (GVKEY 4503, Mergent 7846)