
Introduction
This article shows that reported profit level indicators (PLIs) used in transfer pricing are distorted when intangible-producing expenses such as R&D are expensed rather than capitalized. For margin-based PLIs the distortion falls on the numerator alone; for asset-based PLIs it falls on both the numerator and the denominator, and its direction reverses over time. The sections below derive the restatement, illustrate it with a worked example, and set out the consequences for the operating margin (OMAD) and for return on assets (ROA) as specific PLIs.
First, define the accumulation equation for the stock of R&D capital up to period t, with an initial stock at time 0 of K0 and R&D outlays of Xt at any time t, with 0 < δ ≤ 1, where δ denotes the constant rate at which the stock of R&D capital depreciates each period:
K_t = X_t + (1-\delta) K_{t-1}Expanding over k periods:
K_t = X_t +.....+(1-\delta)^{k} X_{t-k} + (1-\delta)^{k+1} K_{t-k-1}Letting k = t-1:
K_t = X_t + ..... +(1-\delta)^{t-1} X_1 + (1-\delta)^t K_0Therefore:
K_t = W_t + (1-\delta)^t K_0
where:
W_t = \sum_{j=0}^{t-1} (1-\delta)^{t-j-1} X_{j+1}Consider now the case of constant R&D outlays, where Xt = X in every period. In this case we define:
W_t^* = \sum_{j=0}^{t-1} X (1-\delta)^{t-j-1}Multiplying by (1 – δ):
(1-\delta) W_t^* = \sum_{j=0}^{t-1} X (1-\delta)^{t-j}We then have:
W^*_t-(1-\delta)W_t^* = \delta W_t^*
Also:
W_t^* - (1-\delta) W^*_t = X - (1-\delta)^t X = [1-(1-\delta)^t] X
and therefore:
W_t^* = \frac{X}{\delta} [1-(1-\delta)^t]It follows that if for each period an outlay of X occurs then:
K_t^* = W_t^* + (1-\delta)^t K_0
Or:
K_t^* = \frac{X}{\delta} + (1-\delta)^t (K_0 - \frac{X}{\delta})Taking limits as t tends to infinity, and recalling that 0 < δ ≤ 1 ensures the geometric term vanishes:
K^* = \lim_{t \to \infty} \{\frac{X}{\delta} + (1-\delta)^t(K_0-\frac{X}{\delta})\}K^* = \frac{X}{\delta} + [K_0 - \frac{X}{\delta}]\lim_{t \to \infty} (1-\delta)^tK^* = \frac{X}{\delta}Consider the case when K0 = 0. This corresponds to an enterprise that holds no R&D capital at time 0 and builds up its stock of R&D capital from that point onwards. In the limit the stock equals K*, while along the transitional path Kt increases monotonically towards that level.
The cost-capitalized restatement of the original operating profit Pt at time t adds back the R&D outlay of the period and deducts amortization on the opening stock of R&D capital:
P^{'}_t = P_t + X_t - \delta K_{t-1}Assuming Xt = X in every period and K0 = 0, we have from above:
P^{'}_t = P_t + X - \delta \{\frac{X}{\delta}+(1-\delta)^{t-1} (0 - \frac{X}{\delta})\}P^{'}_t = P_t + (1-\delta)^{t-1} XAlong the transitional path restated profits are higher than the original operating profits, and they converge together as t tends to infinity. More generally, restated profit exceeds reported profit only where the R&D outlay of the period exceeds amortization of the opening stock.
Specific Example
For ease of exposition, let’s assume the following parameterization for all times t:
Pt = 100 million USD
St = 1000 million USD
δ = 15%
X = 50 million USD
At = 2000 million USD
Here S represents sales and A the original (not restated) balance sheet asset base; both are held constant over time in this illustration. The diagram below represents the restated profits versus the original profits as time progresses.
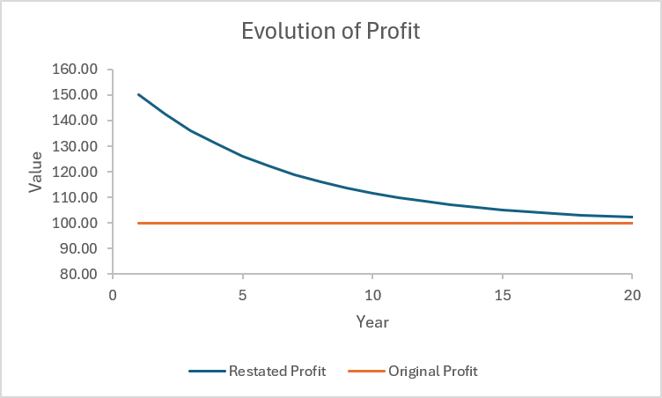
The diagram below shows the restated asset base versus the original asset base as time progresses.
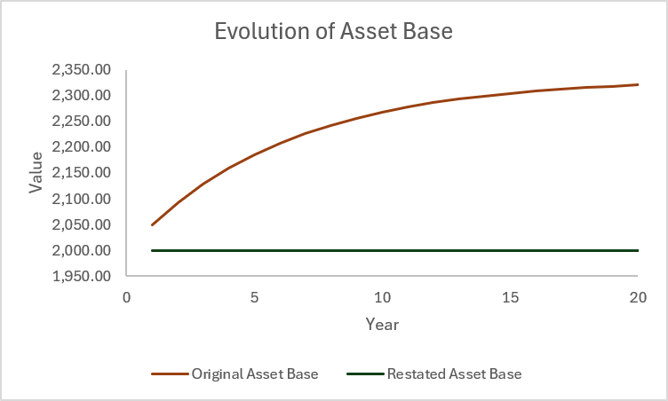
Implications for OMAD
Originally, the operating profit margin after depreciation and amortization (OMAD) equals:
OMAD_t = \frac{P_t}{S_t}The restated OMAD with R&D capitalization equals:
OMAD^{'}_t = \frac{P^{'}_t}{S_t}For the example above, we depict in the diagram below the differences between the two. Note that along the transitional path the restated OMAD is higher but equals the original OMAD in the limit.
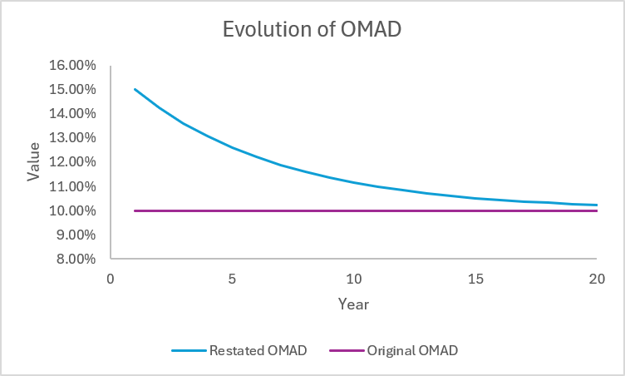
Implications for ROA
Originally, return on assets (ROA) equals:
ROA_t = \frac{P_t}{A_t}The restated ROA with R&D capitalization equals:
ROA^{'}_t = \frac{P_t^{'}}{A_t + K_t}For the example above, we depict in the diagram below the differences between the two. Note that along the transitional path restated ROA is initially higher, but it crosses the original ROA line and falls below it between years 9 and 10.
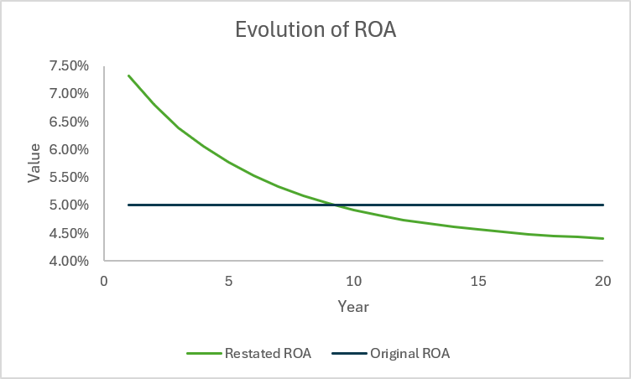
The crossing of the reported ROA line by restated ROA is a general result, not an artifact of the chosen parameters. For all suitable parameterizations of the above example, at some point the restated ROA crosses the reported ROA line. To see this, let:
r_t = \frac{P_t}{A_t}be the reported ROA.
Further, let:
r_t^{'} = \frac{P_t - \delta (1-\delta)^{t-1}(K_0 - \frac{X}{\delta})}{A_t+\frac{X}{\delta}+(1-\delta)^t(K_0-\frac{X}{\delta})}be the restated ROA. Since K0 = 0, this reduces to:
r_t^{'} = \frac{r_t A_t + \delta(1-\delta)^{t-1}\frac{X}{\delta}}{A_t + \frac{X}{\delta} (1-(1-\delta)^t)}It follows that:
r_t^{'} < r_tif and only if:
(1-\delta)^{t-1} < \frac{r_t}{r_t + (1-r_t) \delta} < 1for 0 < r < 1. Therefore, for large enough t, the restated ROA line crosses the reported ROA line whenever reported ROA lies strictly between zero and 100%.
Implications for Transfer Pricing
The key implication is that all PLIs provide distorted measures of profitability when the R&D costs are not capitalized. For example, in the case when an enterprise at some time 0 starts to invest in R&D and accumulates R&D capital, then from that time 0 onwards the restated OMAD is higher than the original OMAD, which in turn implies that the original (reported) OMAD without cost capitalization provides a downward-biased measure of profitability.
The more pressing insight, though, is that return on assets is biased downward in some periods and upward in others, depending on the time period under consideration. In early years the original (reported) ROA is downward-biased; in later years the bias turns upward. A comparability analysis that pairs a tested party with comparables at a different stage of R&D capital accumulation can therefore be biased in either direction. The sign of that bias cannot be inferred without restating each party.
Conclusion
Reported PLIs such as OMAD and ROA provide distorted measures of profitability. In the OMAD case the numerator is distorted by non-capitalization of intangible-producing expenses such as R&D. In the ROA case the distortion is more severe, because non-capitalization distorts both the numerator and the denominator. ROA is thus subject to greater distortion than PLI measures that do not use assets in the denominator and, unlike the OMAD distortion, the ROA distortion changes sign as the R&D capital stock matures.